联系我们

斑马鱼大脑高分辨率全器官成像

[Translate to chinese:] Zebrafish Whole Brain imaging with Leica SP8 spectral confocal laser scanning microscope zebrafish_brain.jpg

Structural information is key when one seeks to understand complex biological systems, and one of the most complex biological structures is the vertebrate central nervous system. To image a complete brain dissected from a developing zebrafish, one would need to cover a field of some ten square millimeters at a depth in the millimeter range. Usually, low magnification lenses do not provide sufficient resolution to reveal the intricate structural interactions in nervous tissue. Additionally, due to scattering processes, the depth at which one can image within dense biological tissue using a confocal microscope is generally restricted to approximately 10 microns.

解决方案


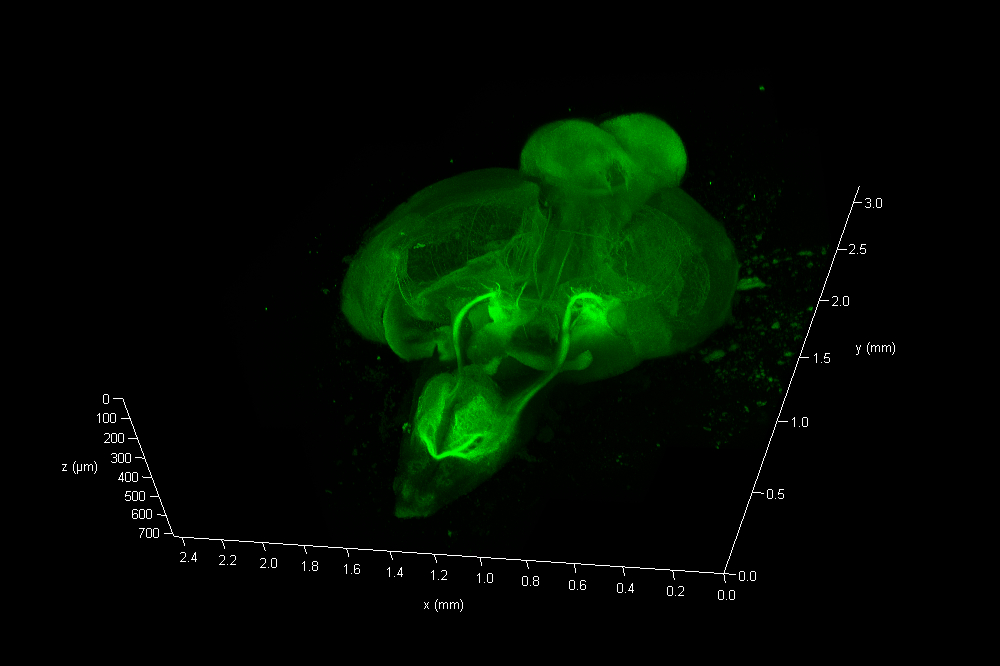
威斯康辛医学院的Link实验室研究眼部发育和疾病,重点研究斑马鱼视网膜神经发生模型。Link实验室的博士研究生Eric Clark试图创构建一幅深度约750微米mm、直径约3 mm的斑马鱼大脑全体积3D图像。为了对神经系统成像,首先使用在神经元泛表达启动子后连接eGFP的基因工具转染斑马鱼,以便在中枢神经系统的所有神经元中产生绿色荧光。

样品清理和物镜


为了减少折射率(Refractive Index, RI)变化引起的散射,需通过被动法透明化切割成小块的中枢神经样品。基于Histondenz的定制折射指数匹配解决方案,使整个光路中的RI保持一致。使用Leica HC FLUOTAR L25×/1.00 IMM物镜[1]对制备的器官样品进行成像,该物镜在1mm× 1mm的范围内提供250 nm的光学分辨率,最大自由工作距离为6 mm。该物镜配备了电动校正环(motCORR),可调整以补偿深度对RI变化的影响。

Video animation of eGFP stained zebrafish

收集高分辨率大视场的信号


为从整个大脑收集数据,Eric使用了LAS X NAVIGATOR采集软件的拼图功能。Navigator允许用户简单地记录大量显微视场下拼接后的图片,并将它们融合为单个3D数据集,同时自动平衡图像采集和拼接过程中的光强变化。所得数据可以通过LAS X内3D查看器的3D可视化软件来呈现(参见动图01)。
最终数据包含286个图像平面,每个平面为5675× 7836个像素。总共12.7千兆个立体像素。

光子效率和样品保护


从荧光样品中收集如此庞大的数据集有一个前提条件,就是必须要有非常灵敏的检测系统,且必须在相对较短的时间内达到高信噪比,同时光漂白程度最低。为满足以上条件,需要使用配备徕卡近无噪的混合探测器[1](HyD)、声光分束器[2](AOBS)和基于棱镜的光谱探测器[3](SP-detector)的激光共聚焦显微镜成像,以实现无滤光片的光谱分离和无级调节的带宽规格。

用户心声


“采用带motCORR的Leica Clarity物镜能够匹配样品透明化/封片介质所需的折射率,并提供更大的工作距离和聚光能力,以便在不同深度对这种敏感样品成像。”

Eric Clark, Ph.D. candidate, Medical College of Wisconsin. Milwaukee, Wisconsin (USA)

References

  1. Clearing Procedures for Deep Tissue Imaging
  2. Which Sensor is the Best for Confocal Imaging?
  3. Primary Beam Splitting Devices for Confocal Microscopes
  4. Spectral Detection – How to Define the Spectral Bands that Collect Probe-specific Emission

相关文章

相关页面

Background image
Scroll to top